Climate Temperature Change
Description
This is an experiment that investigates ways of visualizing the average worldwide monthly temperature anomalies from 1850 to 2017 via data from the UK Met Office. You may have seen the renowned Climate Spiral images created by UK scientist Ed Hawkings - this is a modest attempt to explore other ways of visualizing that same sobering data using modern web technologies such as WebGL.
Moreover, I purposely made a point of using different techniques for each - colored WebGL lines, irregular stacked polygons, CatmullRom splines etc. so that I could explore new ways of rendering this kind of data.
There are 4 different visualizations in this initial release and since the source code, data etc. is all freely available under a non-restrictive MPL license, I am hoping that others will pitch in and create new ones or improve the existing ones.
Visualizations
All of them try to show the temperature in a vertical stack with the year 1850 at the bottom and the present day (currently 2017) at the top. Each year is nominally divided into 12 months and the magnitude of global temperature anomalies are plotted as a function of distance from the center line and a color from blue (cool) to red (hot). It seems pretty clear that the global world temperature is rising.
I take the freely available source data from the UK Met Office (HadCRUT 4) and create a larger smoothed dataset, either on a yearly basis for the Rings, Slices and Blob or for the whole time period for the Spiral. The code plots the data based on the settings you choose. I am well aware that this interpolation introduces inaccuracies in the data when viewed as a precise measure of temperature for a given year / month and whilst that is one of the things I wanted to explore, this experiment is more about making something visually interesting than letting you find an exact values. The current visualizations are:
Rings - Each year is represented by a single ring.
Spiral - Each 'loop' of the spiral represents a year so in that sense, it is similar to the Rings - the difference is that the value for January in a given year smoothly follows the one for December in the previous year - just like the real world - as opposed to a sudden change for the Rings.
Slices - Each slice in the stack represents a year so this one is similar to Rings but I liked the way the stack looked.
Blob - This version is a bit like the slices except the values are smoothed out vertically as well as horizontally. It might be interesting to consider 3D printing a small version of this in color and give it out at climate conferences as a reminder of the scary things that are happening.
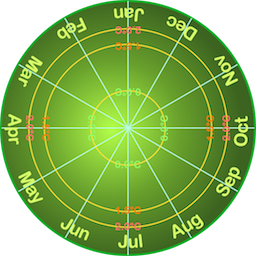
Legend
The legend shows the months of the year and the magnitude of temperature anomalies. It can be moved up and down through the visualization using the slider on the right side of the screen. You can toggle it on and off using the settings controls described below.
Controls
You can examine, rotate and zoom each visualization using the mouse and mouse wheel (or touch / pinch on mobile devices)
The controls on the main page are:
 opens the settings drawer (see below)
 opens a new browser window with current settings that you can bookmark or share
 opens this page
 select Rings visualization
 select Spiral visualization
 select Slices visualization
 select Blob visualization
The settings drawer options are:
- Smoothed points - number of smoothed points to generate from source data
- Line thickness - thickness of the line to use for the Rings and Spiral versions
- Fit camera - when enabled, keeps the camera positioned so the visualization fills the screen
- Colors - switches between hot/col temperature (red/blue) colors and a pleasing rainbow effect
- Auto rotate - enables or disables auto rotation of the visualization
- Enable legend - enables or disables the legend that shows the months / temperatures along with associated controls
Acknowledgments
- Ed Hawkins - made initial version in 2012
- UK Met Office - HadCRUT 4 source data
- three.js - A nice JavaScript WebGL library
- Chroma.js - a nice JavaScript library for working with colors
- noUiSlider.js - a nice JavaScript UI/Slider library
- tween.js - a nice tweening library
Contact
- Visit my page at http://callum.com to see other experiments and find contact information
- The source code for this project is available along with source for everything else I've made here
- Advice, suggestions, bug reports, pull requests etc. much appreciated